Heatsink contact pressure, read at the joint
A heatsink is rigid and a die is flat, so the rated mounting torque can still leave most of the interface with a gap. The pressure that decides thermal resistance stays invisible — unless a film goes into the joint and measures it.
Mounting torque is a force, not a field
An active device dissipates heat into its package, the package into a heatsink. For that path to work the two surfaces have to close across their whole area, at a pressure high enough to keep the thermal interface material at its design thickness. The difficulty is mechanical: a heatsink base is stiff, the mating surface is hard, and neither is perfectly flat. Clamp them together and contact usually starts at one or two points and leaves the rest of the nominal footprint with a gap.
A torque wrench controls the total clamping force. It says nothing about how that force divides across the base. Two heatsinks fastened to the same torque can differ by a factor of several in mean interface pressure, and the one with the higher peak can be the one with the worse thermal path — because the peak is carrying the load while the rest of the surface is doing nothing.
Base flatness and warp
A base that is convex by a few tens of microns closes at the centre and leaves the perimeter open. Torque is on target; the perimeter is not conducting.
Fastening sequence
Four screws tightened in the wrong order tilt the base. The last screw to be tightened carries a disproportionate share, and the opposite corner loses contact.
Interface material thickness
A pad that is thicker in one region compresses the contact there and relieves it elsewhere. The map shows which region paid for it.
A film thin enough to stay in the stack
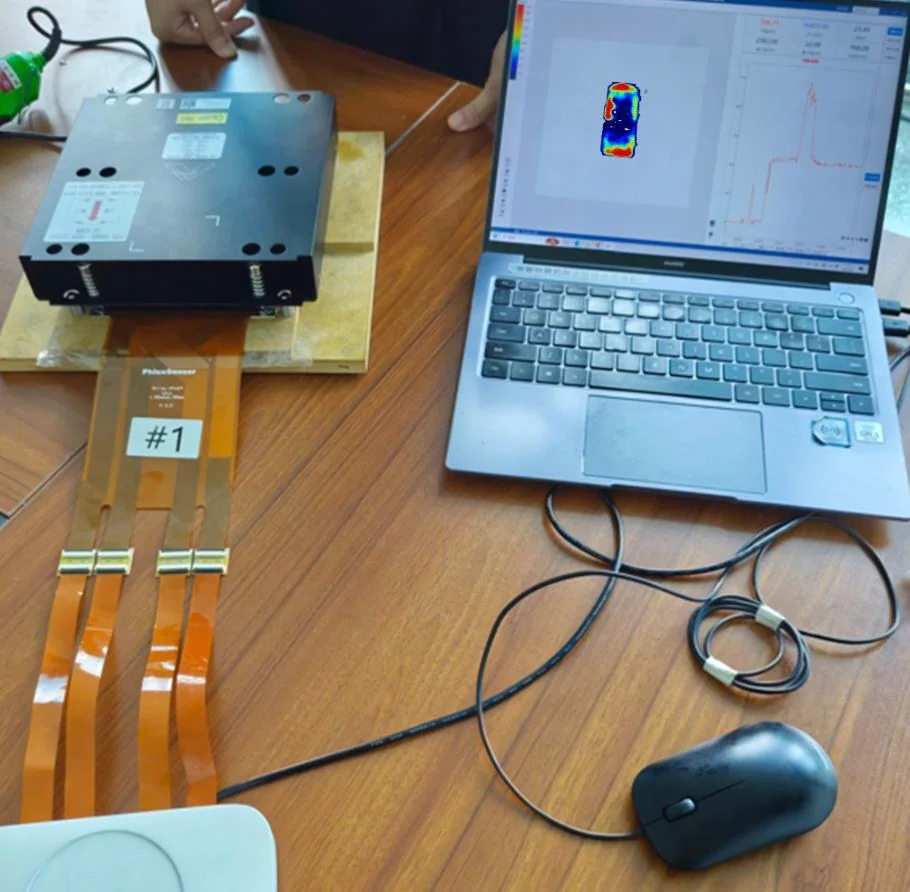
The array is 0.3 mm thick with a 1.5 mm sealed border and a 300 mm lead. It is laid on the heatsink base or on the heat source, the assembly is closed at the torque and sequence used in production, and the pressure field is captured while the joint is closed. After the reading the film comes out and the thermal interface material goes in.
During assembly, not after
The map is read while the joint is closed, at production torque and production sequence. A slow, careful closure flattens exactly the gradient the check is looking for.
Turn a judgement call into a number
Screw order, washer size, base thickness, pad hardness — each change moves the field in a way the map records. The comparison is the deliverable, not the single picture.
Sample a batch
The same measurement on a sample from each batch separates units that are within the process window from units that are not, before they are built into a module.
Keep the record
Every reading is stored with its seal, peak, mean and standard deviation, so a process change three months later can be judged against the numbers rather than against memory.
A 2,505 mm² footprint, half of it doing nothing
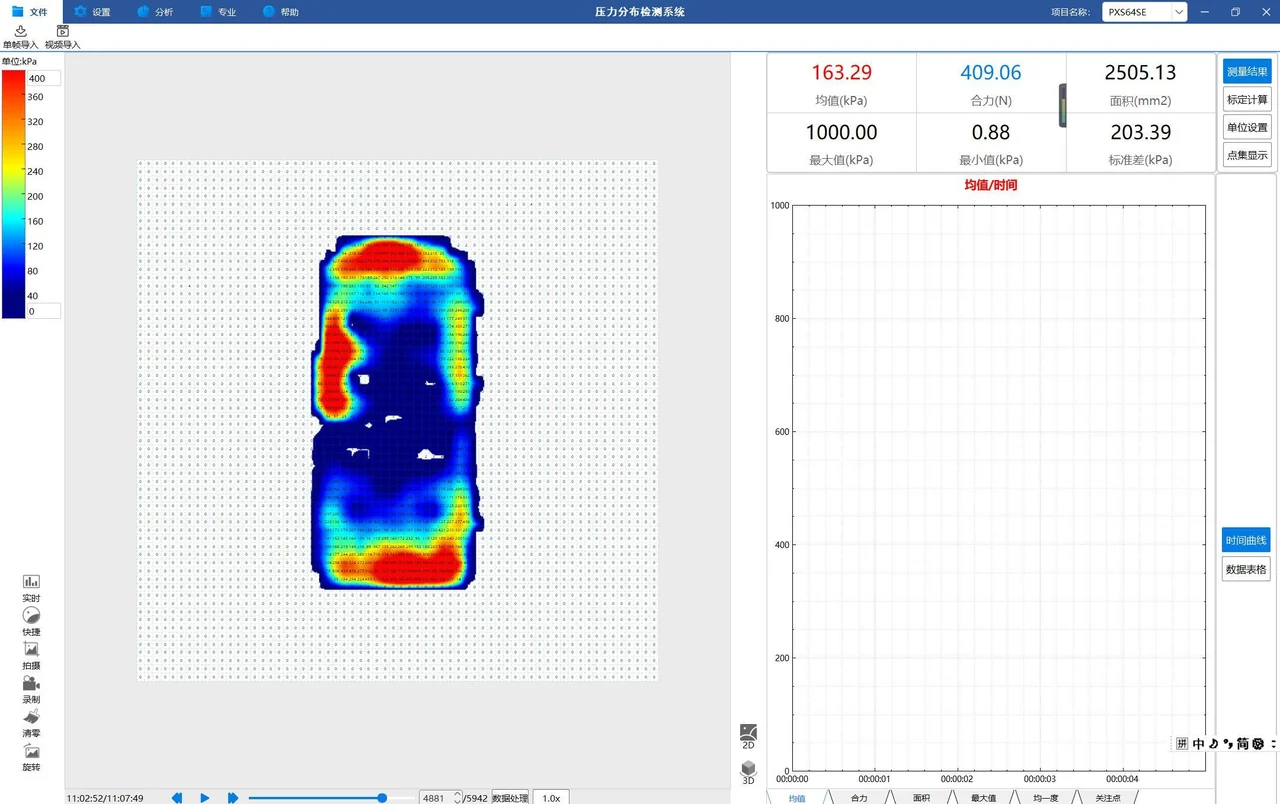
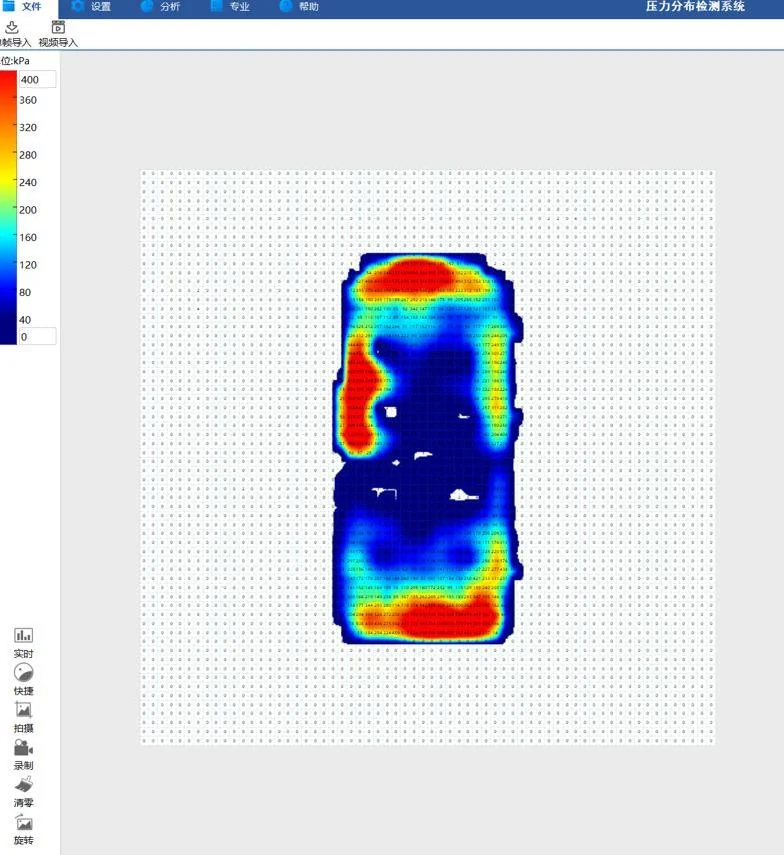
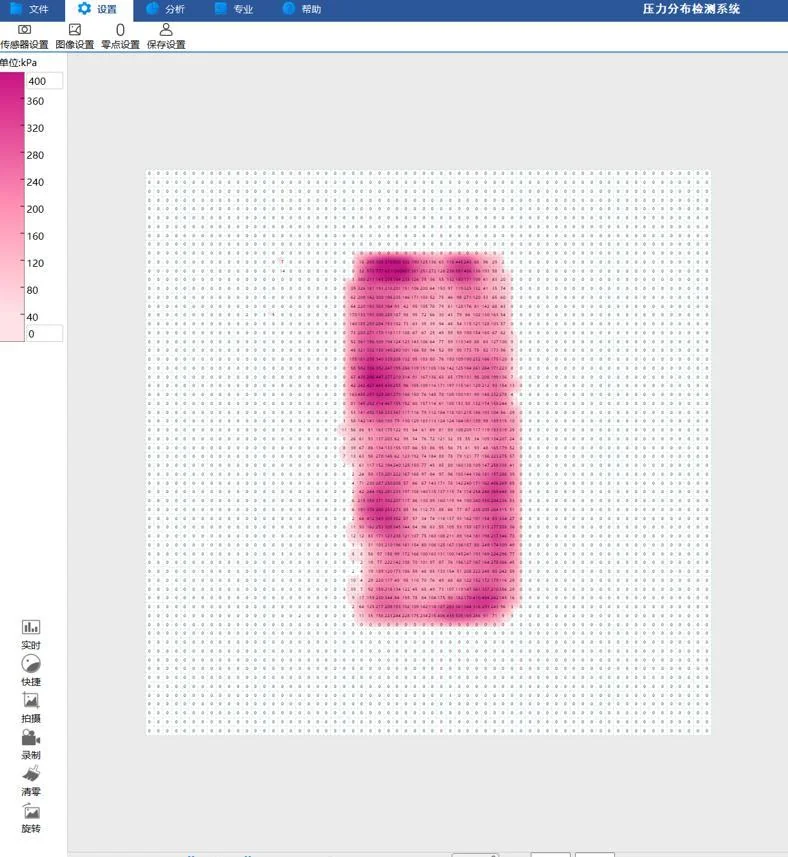
The trace in the gallery above is a real heatsink assembly, not an illustration. Across a 2,505 mm² footprint the mean was 163 kPa and the peak 1,000 kPa, with a standard deviation of 203 kPa — a spread larger than the mean itself. Total force was 409 N, which on the press dial looks entirely reasonable.
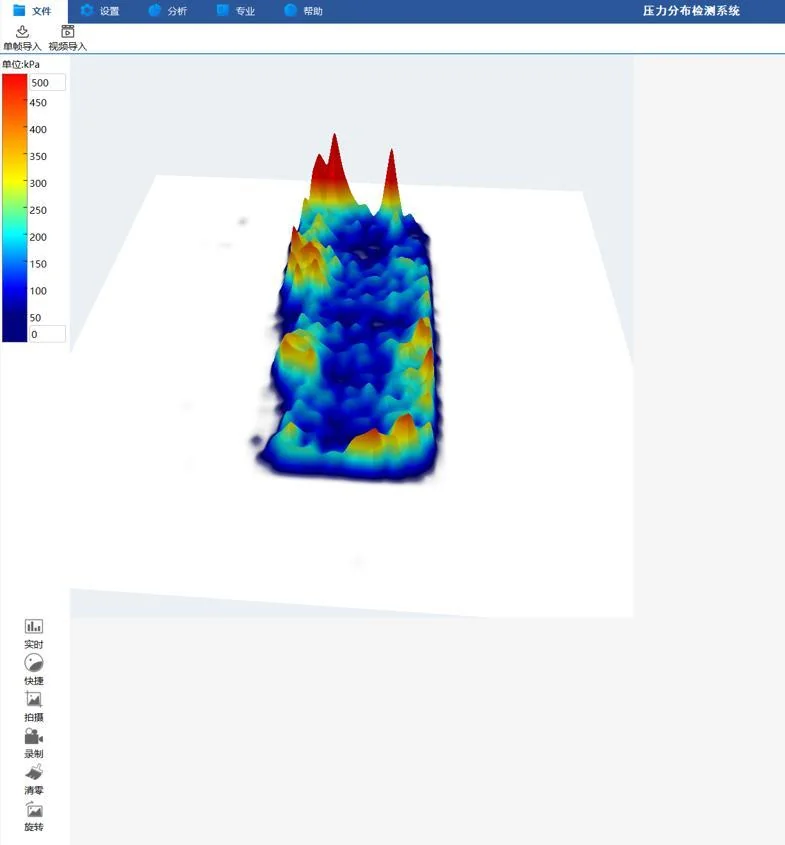
The field explains why: contact concentrated at both ends, where the fasteners sit, and dropped away through the middle. That is the signature of a base that is not flat under load, or of a fastening sequence that tilts it. Neither is visible from the torque value, and neither would be found by checking the joint temperature alone — the die would simply run hotter than the model predicted, and the difference would be attributed to the interface material.
| Parameter | Measured by this setup | What it means in this interface |
|---|---|---|
| Contact area read | 2,505 mm² | The area that actually closes — not the area of the heatsink base. |
| Mean pressure | 163 kPa | What the thermal interface material sees on average, which sets its compressed thickness. |
| Peak pressure | 1,000 kPa | The fastener-side ridge. The ratio of peak to mean is the measure of how uneven the joint is. |
| Standard deviation | 203 kPa | Higher than the mean. In a well-designed joint this number is a fraction of the mean, not a multiple of it. |
| Total force | 409 N | What the press or the torque calculation reports. It is correct, and it is not enough. |
One production assembly, one torque setting. The numbers are reported as measured; they describe this joint, not a specification.
What the array saw
Traces from real assemblies, with the numbers read at the time. Nothing in this gallery is a rendered illustration.
Where this setup stops working
Every one of these has cost somebody a re-test. They are listed here rather than discovered on site.
This needs a low-pressure range
The standard PD-FS build covers 400–6000 kPa. Heatsink interfaces usually sit well below that, so the array for this work is a low-range build — the trace above was taken on a 0–400 kPa range. It has to be specified as its own item, with its own calibration, not assumed from the standard sheet.
The film occupies the interface it measures
At 0.3 mm it is the same order as the thermal interface material itself. Used as a check it is removed afterwards; it is not a layer you leave in a shipped assembly. Where the film is left in for a repeat reading, the compressed thickness of the interface changes and the thermal result changes with it.
Room temperature only
Readings are taken with the assembly at ambient. At operating temperature the heatsink, the die and the fastener stack expand differently, and the contact field moves — usually toward more contact at the centre and less at the edge. This method characterises the cold joint; the hot joint has to be inferred or measured another way.
20 Hz is for assembly, not vibration
Press closure, screw tightening and creep under load are all inside the sampling window. Shock, transport vibration and fan-induced excitation are not. Those need a different acquisition chain and a different sensor.
Surface condition reads as pressure error
A contaminated base, a thick conformal coating or a damaged pad surface changes the contact mechanically. The map will show it as low pressure, which is honest but easy to misread as a flatness problem.
It does not measure thermal resistance
The map shows the mechanical cause. It does not report junction temperature or thermal impedance. Correlating the two is a separate experiment, and a useful one — but it is a correlation, not a conversion.
The parts this measurement is built from
Film, collectors and software are quoted as one chain — the sheet count follows the surface.
Frequently asked questions
No. The film is a compliant polymer layer with a sealed border; it is placed between the two surfaces and removed after the reading. What it does require is a clean surface on both sides — contamination is the most common reason a first reading looks wrong.
Not in the standard build. It is 0.3 mm of polymer in a thermal path, and it would change the interface thickness it is meant to be checking. It is a process-development and inspection tool: measure, remove, assemble with the intended interface material.
Usually far below the standard film range. The assembly in the trace above ran on a 0–400 kPa array. State the expected mean and peak at the enquiry stage — the low-range build is a separate item with its own calibration, and it is not something to extrapolate from a 400–6000 kPa sheet.
The standard sheet is 4096 points on 490 × 520 mm, which is far too coarse for a die footprint of a few square centimetres. Small-area work uses a custom array geometry at a much shorter pitch. Send the footprint dimensions and the smallest feature you need to resolve.
It answers a different question. Indicating film gives one irreversible peak snapshot, with no numbers and no repeat. The electronic array gives a calibrated field you can read again, compare between builds, and store. Film is cheaper and thinner; if a go/no-go check is all you need, film is the right tool.
For sampling, yes — the reading takes the same time as closing the assembly. For 100% inspection it is not the usual answer, because the film has to be handled, inserted and removed at line speed. Most users apply it to process qualification and batch sampling, not to every unit.
Different surface, same method
CMP polishing head pressure, read at the wafer
A polishing head controls pressure with air. Air pressure is not interface pressure: pad wear, film thickness and edge…
Blade surface pressure mapping
A strain gauge tells you the load arrived. It cannot tell you where it concentrated, or whether the peak on the trace…
Bond-line pressure, read before cure
A press reporting the correct total force can still leave half a bond line starved. The number that matters is pressure…
Send us the surface and the decision it has to support
Area, peak pressure, the feature you are looking for, and what happens if you miss it. That is enough for a first assessment.